Provider Scorecards

Program Year 2020 Training Provider Metrics
Executive Summary
Scope
Santee-Lynches Regional Council of Governments (SLRCOG) Workforce Development Department staff engaged in the development of Workforce Innovation and Opportunity Act (WIOA) funded Training Provider Metrics to gauge progress in meeting Federal, State and Local objectives and to identify where adjustments should be made to optimize performance and increase the stewardship of the Grant Funding being received. These metrics will also assist in better management of our programs and increase accountability of businesses and the SLRCOG to the public. Good metrics should promote strategic analysis. Demands for higher levels of accuracy and specificity provide the potential to make improvements to our local workforce. Promoting quality is the key objective for this set of metrics. These metrics assess process as well as progress. A deliberative course of selecting the few most important metrics, collecting the necessary information, and carrying out the evaluation is the goal. Although each of these principles is important, three merit especially careful attention: (1) leadership to guide the program and apply the metrics, (2) a plan of action against which to apply the measures, and (3) the potential to use the metrics not just as a simple measure of progress, but as tools to guide strategic planning and foster future progress. This developing system of metrics, implemented through continual process and evaluated in consultation with Training Providers, will be a valuable tool for managing the SLRCOG WIOA funding and for further increasing its usefulness tour region.
Training Metrics Methodology
The Training Provider Metrics have been designed to show measurable outcomes. These metrics account for the knowledge that the outcomes cannot be solely based on the Training Provider and must be proportionally absolved from the individual(s) being trained. 25% of the rating is to be absorbed by the individual(s) being trained. The following outcomes are being measured: Training Completion Rate, Entered Employment Rate and Training Related Employment Rate.
The maximum score is 75%, as the 25% has been accounted for. The scale is as follows:
A: 75-65, B: 64-55, C: 54-45, Deficient >45
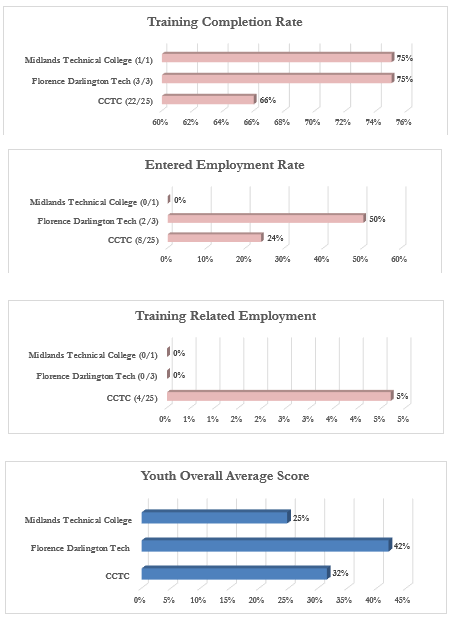
Summary for Adult, Dislocated Worker, and Youth:
Training Completion Rates are consistent in the “A” range with an average score of 71%. This reflects well on the Training Provider and Case Management in that the participants are successfully completing the training they have pursued. This category rests heavily on the administration of the training as well as the participant’s desire to complete.
Entered Employment Rates are consistently in the “Deficient” range with an average score of 43%. This metric weighs more heavily on the path participants decide to take once training is complete. The Training Provider’s quality of service does play a key role, but the rate is based more on the participant.
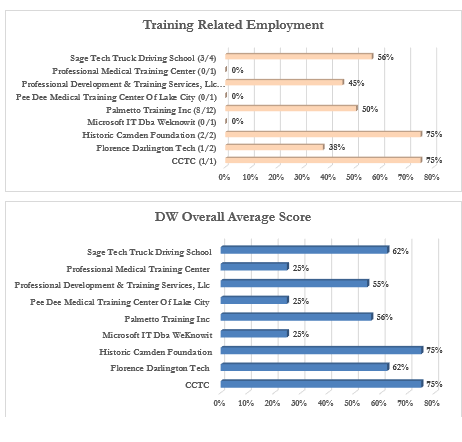
Training Related Employment Rates are consistently “Deficient” with an average score of 25%. This metric shows the importance of the training as it relates to the participants’ skill attainment for those providers who have positive training related employment rates. For providers with low rates, the quality of the training is not the sole indicator as the participants’ decisions are also a key indicator.
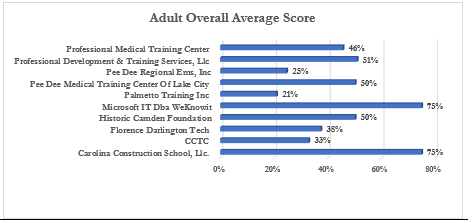
Overall Average Scores average 46% or a “C” range. As this is a combination of all three metric categories, the score reflects an accurate story of the process from Case Management enrollment to employment attainment. The implementation of aforementioned opportunities for improvement will promote an overall increase in scores.
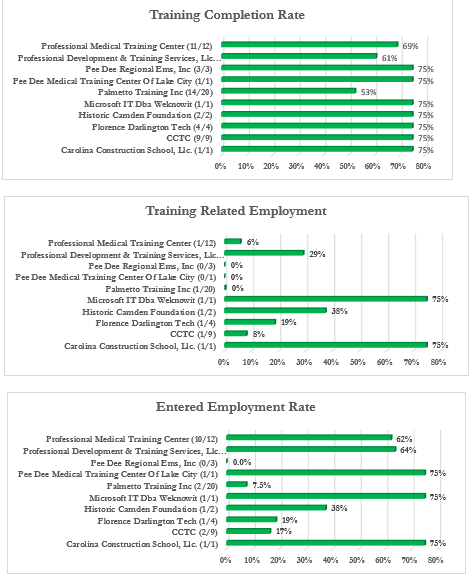
Program Year 2020 Adult Training Provider Metrics
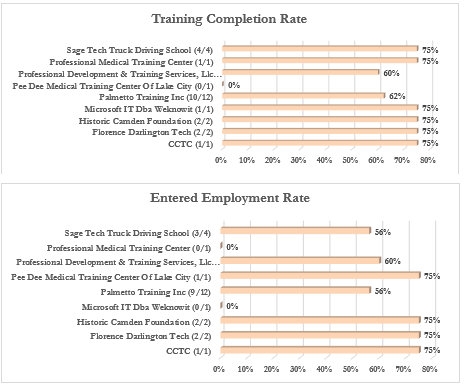
Program Year 2020 Dislocated Worker Training Provider Metrics
Program Year 2020 Youth Training Provider Metrics